Capacity Utilization, the devil in the details
Summary: Data indicating higher capacity utilization (CU) is misleading. This author believes that higher CU is reflective of lower capacity additions over the past decade than of any meaningful increase in demand. An innovative analysis of inventory data released by the RBI suggests that corporates too do not appear to be in the mood to crank up activity. This author believes that any government stimulus package that focuses on higher government spend, and tweaking of GST rates will be akin to pushing on a string. To make a meaningful difference to economic activity needs a two pronged solution, a) ease capital constraints at banks, and b) put more disposable income in the hands of the ultimate consumer by slashing direct taxes.
About ten days ago, the Reserve Bank of India released the results of its OBICUS survey on capacity utilization, that indicates capacity sweating in 4QFY19 was the highest in the last five years:
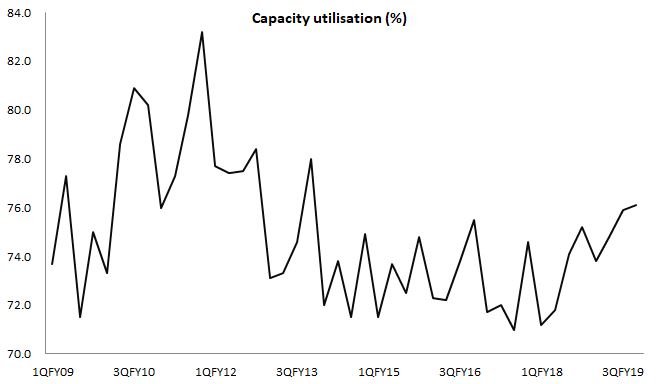
While this has been seen by some as a sign of revival in demand, this author has a less enthusiastic view. I believe that the increase in capacity utilization is a result of capex that has been curtailed over the past several years. Annual investments have declined 60% from FY11 levels to Rs1.48 trillion in FY18.

This however is not surprising to this author who has been highlighting the capital constraints faced by banks (and thus ultimately by borrowers) over the past several years. After being gobsmacked by the karma of their laissez-faire lending practices in 2005-2011, Indian banks have scurried to safety by shifting credit flow away from corporates to retail.

Mix of Credit that is O/s to industry borrowers witnessed a steady decline from ~43% to ~34%, even as retail credit rose from 16% to 22%. Interestingly, the decline in corporate lending was driven more by lower lending to manufacturers/processors, and not by real estate/ construction lending. The increase in personal lending was driven by non-mortgage lending suggesting that perhaps higher risk has been taken by lenders in order to report higher NIMs.

Source: RBI
But I digress. What is clear is that private capex has been stymied over the past decade almost, due to a combination of lower demand, and capital scarcity. As such, this author believes that the current bump in capacity utilization is more due to a decline in the denominator, rather than an increase in the numerator of the utilization equation.
This can also be demonstrated quantitatively, albeit roughly. RBI also releases the Total inventory/ sales, Finished Goods Inventory/ Sales, and Raw Material Inventory/ sales of its survey universe. By some primary arithmetic we can actually workout the composition of the total inventory, between finished goods (FG), raw materials (RM), and W-I-P. This is how the mix of FG and RM looks:

The period FY13 to FY16 saw a meaningful increase in FG as % of total inventories of corporates even as raw material inventories declined. Now one needs to juxtapose this with the margin data of corporates during this period, also taken from the RBI, as below:

Source: RBI
There appears to be a clear divergence between the three classes of manufacturers.While large companies were able to maintain and even improve their margin between FY13 and FY16, medium sized and smaller sized companies did progressively worse in this department. What this suggests to this author is that larger companies with better information sources saw an imminent slowdown monetised as much of its inventory as possible. Medium, and small firms were less informed, or less able to do this (and were perhaps at the mercy of the larger cos, who squeezed them on price), causing margins to decline, and even go negative.
Post FY16 till date, one can clearly see that RM dominates the inventory mix of corporates, and actual processing of material as declined precipitously. FG are not being made as much, as corporates do not see enough demand on the horizon.

Source: Derived from earlier derivations of FG/ total inventory and RM/ total inventory data from RBI's survey. Total inventory = FG+RM+WIP
The higher RM is meaningless as an indicator of "dry powder" for anticipated demand, as overall inventories have declined (thus transmitting demand fall through the value chain):

Source: RBI
It is clear that the government needs to focus on both aspects, ie easing capital constraints, as well as stoking demand. While the first can be done by raising funds abroad, as suggested by this author last year, the second step will involve reducing direct taxes instead of GST rates. People need to 'see' extra disposable income in their hands, causing them to spend. Any stimulus package that depends on government spending will simply not suffice, and due to its crowding out effect may actually be inappropriate.

Comments
Post a Comment