PMC Bank fiasco: Predictable?
Punjab Maharashtra Cooperative Bank (PMC) is latest in the series of bad news emanating from the Indian banking sector. While this was a result of misfeasance by PMC bank's management and thus not systemic in that sense, it does raise question marks on the audit and scrutiny procedures of the Reserve Bank of India (RBI). The details of the scam and how the management hid it, can be read from this link for those interested.
So, was it possible to gauge that the books of PMC were not really kosher? To examine this issue, this author made a series of bell curves in MS- Excel of select financial data for a sample universe of 54 Urban Cooperative Banks, the peer group of PMC. The data was obtained from the RBI website. The bell curve will allow us to easily juxtapose the select financial data for PMC vis-a-vis the average data for the universe of its peer group.
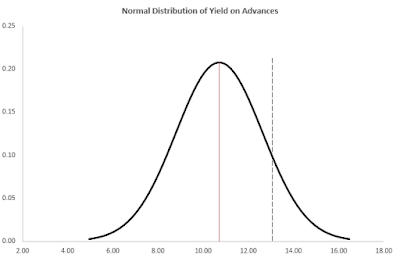
The central brown/ golden line denotes the average of the data being studied in each graph. For example, in the first graph, we can see that the average yield on advances earned by the peer group was 10.73%. As compared to this, PMC (depicted by the dotted line) managed to earn a better yield of 13.00%. In fact, in each of the metrics above, PMC has performed better than the peer group, earning a higher net interest margin (NIM), a better Return on Assets (ROA), and as higher yield, than its peers. Perhaps, this itself should have been some sort of red flag? Banking as a sector is very homogeneous in that it deals with the exact same commodity, i.e. money. Therefore any bank that is reporting results that that very different from its peer group, merits a deeper study, which presumably was not carried out in this case.
Now given this data, and the allegations that the management of PMC was actively manipulating its books so as to mislead, one can sympathise with its auditors who were looking at just that one Bank, at a time. However, it is this author's suspicion that had the Bank been looked at closely at a regulatory level, especially when compared to its peer group, it was not impossible to sense that all was not above board.
To make this point, I would like to present two more bell curves for the Bank. But before that I would like to explain two terms.
1) Capital Adequacy Ratio (CRAR): This is the ratio of a bank's capital to its risky assets. Risky assets that the various loans and investments made by the bank. In order to ensure that the bank does not take undue risk, RBI mandates that capital of a scheduled commercial bank should be at least 9%. One of the most important regular sources of increase in the capital of a bank is its annual profit.
2) Interest Spread: This is different from the NIM that we have seen in the earlier chart. NIM is calculated as the ratio of Interest income minus Interest expense, to total interest earning assets of the bank. Loosely, this is akin to the 'operating profit margin' for a bank. Interest spread however is the difference between the average interest rate that a bank earns on its assets and the average rate of interest it pays on its liabilities. Interest spread indicates how profitably the bank is able to deploy the funds that are available to it.
Now for the two charts, the first is the bell curve for the interest spread, and second is for CRAR.
The first chart shows that PMC's capital to assets ratio (CRAR) is appreciably lower than the average for its peer group. While not incorrect, it is indeed surprising given that PMC has been earning yields, and returns that are well ahead of peer averages (as seen from the first set of bell curve charts). If nothing else, this should have raised some questions in the mind of the regulator.
But it gets even more interesting. The interest rate spread earned by PMC is nearly 1 standard deviation higher than the peer average. Higher interest spread suggests that PMC was indulging in lending to a higher risk borrower group. It does not matter whether this was one party, or a group of independent borrowers. The fact remained that here is a bank that had a capital adequacy on the left tail of its peer bell curve, despite having returns on the right tail, and spreads that indicative of higher risk lending. With data being uploaded with RBI, there is no reason why this check could not have been run by machines to identify at-risk banks. As such, this author believes that the responsibility of the PMC bank scam being hidden does lie with the RBI for failure to detect it at least one year ago, if not earlier than that.
Given that the cooperative banking space in India is riddled with various issues, not limited to interference by politicians, sub-optimal treasury management, and relatively lesser transparency, RBI should consider running the following check on these banks:
Run a scatter plot of banks that report higher than peer group interest rate spreads, but lower than peer group CRAR.
The result of the above, will give RBI a group of banks that will merit a close inspection. This would enable the regulator to identify problem banks taking a bird's eye view, in addition to solely relying on micro focused auditors. It is time to leverage data, and mine it, to create new knowledge avenues and nip problem areas in the bud.


Comments
Post a Comment