Posts

US Bond yield, treading water
Image
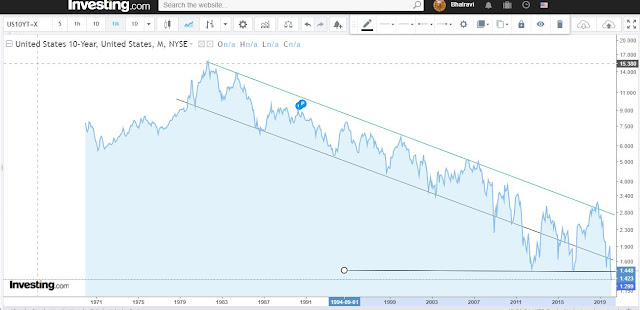
This is a market that trades between US$ 500-600 billion a day, one of the most liquid markets in the world (behind the forex market). This is why the breach of a long term support or resistance has that much more significance, because more traded the security the more credible are its turning points. As you can see from the below chart, the US benchmark 10 year yield has largely followed the discipline of its long term trend lines. The collective greed and fear of the markets is more completely reflected in the bond markets than in the equity markets, since large institutions like banks, insurance companies, central banks etc. (what are considered as sophisticated investors) trade in this market.  Even more so the US Bond market that is considered the safest yield bearing asset and often a refuge for investors fleeing uncertainty.  Primer: Bond yields are inversely related to the price of the bonds. When bond price rises, the yields fall, and vice versa. Bond pr...
China: Till Debt do us apart

This is a follow-up piece to my earlier note, Debt-plomacy  that highlighted how China has used its currency printing presses liberally, to accumulate a global footprint of strategic investments. As per data compiled by the American Enterprise Institute, and The Heritage Group, between 2005-2019, China is estimated to have invested over US$ 2 trillion in 150 countries globally, gaining political and social influence in return. For perspective, it is worth noting these investments were more than the addition in the total Indian GDP during the same period (US$ 0.8 trillion in 2005 to US$ 2.72 trillion in the last fiscal). This global thrust by the Chinese, is underpinned by its ability to print money without apparently pushing up the CPI. One wonders if this is a uniquely Asian phenomenon where lower interest rates  on savings actually spur people to increase savings, rather than consume (Gross Domestic Savings in China are 45% of its GDP). There are of course contributing i...

Germs Inc. and the Butterfly Effect

Image
A new strain of a CoronaVirus is reportedly wreaking havoc in China, and has supposedly spread to over ten countries (including in Europe). This virus is said to have originated in snakes or bats and tramistted to humans in the food market in Wuhan, but there is no dearth of alternative explanations as regards to the provenance of this killer.  The propensity of the Chinese to keep things bottled up is well known, and just the fact that they are opening up about this super-virus serves as a good indicator of how widespread the threat truly is. There is a nation-wide ban on wildlife trade as a result, and over 56 million people in 20 cities have been effectively quarantined via travel restrictions. While officially infections are said to be restricted to under 2,000 people, there are some reports from alleged ' whistle-blowers ' who peg the number at nearly 90,000 patients.  While no one really knows how much toll this virus will extract, I do think the impact of lar...

Debt-plomacy, or How China Eats The World

Image
The rise of China has been the defining force of the last 15-20 years. Its economic miracle built on the back of debt and liquidity, and investing for an export driven economy drove commodity prices, and indeed global geopolitics. Its worth noting that per some estimates China's total debt today tops 300% of its GDP, and at an estimated US$40 trillion accounts for 15% of all global debt. But arguably, the export miracle never really materialised with net exports accounting for only about 2% of the total rise in GDP between 2006 and 2019. However there is another aspect of the China story which, albeit not ignored, is not as appreciated as one believes it should be. This pertains to Chinese investments in other countries, a strategy that appears to be driven more more by foreign policy, than economic considerations. These have totaled a staggering US$ 2 trillion in the last 15 years, as per data compiled by the American Enterprise Institute and The Heritage F...

India: Journey to US$5 trillion

Image
It is the stated goal of PM Narendra Modi to make India a US$ 5 trillion economy by the year FY 2025. For perspective, India's nominal GDP stands at US$2.7 trillion in FY 2019, suggesting that a Cagr of 10.7% would be required over the next 5-6 years to achieve this target.  For a better understanding of this journey, I decided to look at China for guidance. China had a ~US$2.7 trillion GDP in the year 2006, and managed to achieve a US$5 trillion in just three years (by 2009). A scorching GDP Cagr of 22.9%.  What stood out for me is how little "exports" contributed to this rapid rise in the GDP for China. This is particularly interesting because for those who even cursorily followed economic news around this time, primarily knew China as an export miracle.  In reality, increase in exports contributed only 0.5% of the total increase in GDP between 2006 and 2009. Yes, just US$12bn of the GDP increase came from net exports. The primary driver for China...

September 2019 Inflation print, nothing alarming

Image
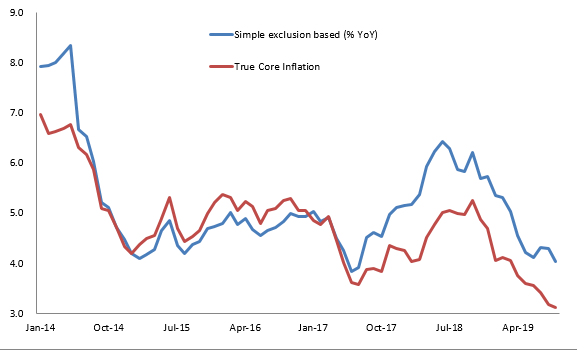
The latest reading of the Indian CPI (Sept 2019) came out at 3.99%. This may cause some re-think within policy circles on the current rate reduction cycle. However, a closer look at the data suggests that there is nothing alarming about this print. First, it is still slightly below the target inflation of 4% (-/+ 2ppt). Second, the core inflation, even as its calculated using exclusion method has actually come down from 4.3% in Aug19 to 4% in Sept. Finally, if we were to use my true core measure (i.e. excluding items based on their actual volatility and not just the food+fuel exclusion), then the core inflation has come down to 3.11% in Sep-19 from 4.69% in Dec-18. In fact the core inflation continues its downtrend unabated as seen below: The rise in inflation in September 2019 was due to a surge in volatile items. Notably, despite this surge the volatile inflation has not broken above the technical downward trend line. Given where it is poised today, I believe it will ho...

Musings on the Taylor Rule

Image
Summary: While admittedly RBI does not strictly follow the Taylor rule, it is a useful tool in analyzing policy. The current rate stance of RBI implies a trend growth rate of only about 3%, a sharp discount to long term growth target of 7%. RBI would need to cut rates by over 200 bps to reach a level where trend growth of 7% can be accommodated under the Taylor Rule mechanism. While at the current anemic cut size of 25 bps each review cycle, it would take well over a year to reach this level. Analysis of its past rate cuts using the Taylor formula suggests that RBI has been more reactive to output gaps than inflation gaps. This is in itself surprising given how much of the chatter around policy announcements is dominated by inflation data. Given that India is today facing a favourable inflationary gap, as well as negative output gap, it is intriguing to note RBI's continuing gradual approach to monetary policy. On the backdrop of another anemic cut in rates by the Reserve Bank...